
Windows Server optimization is the deliberate process of measuring resource bottlenecks and applying targeted configuration and hardware adjustments to maximize server performance and stability in enterprise settings. Without a structured windows server optimization guide, administrators often apply random fixes that mask symptoms rather than resolve root causes. The most effective approach starts with measurement, moves through hardware validation, and then applies role-specific tuning across CPU, memory, storage, and networking. Tools like Performance Monitor, Task Manager, and Event Viewer are your primary instruments throughout this process.
What is the windows server optimization process and where do you start?
Effective optimization is bottleneck isolation with measurement. You correlate user-impact symptoms with resource pressure metrics rather than reacting to average CPU usage alone. Microsoft's own guidance reinforces this: start with symptoms, use scenario-based troubleshooting guides, and avoid arbitrary tuning. That discipline separates administrators who fix problems from those who create new ones.

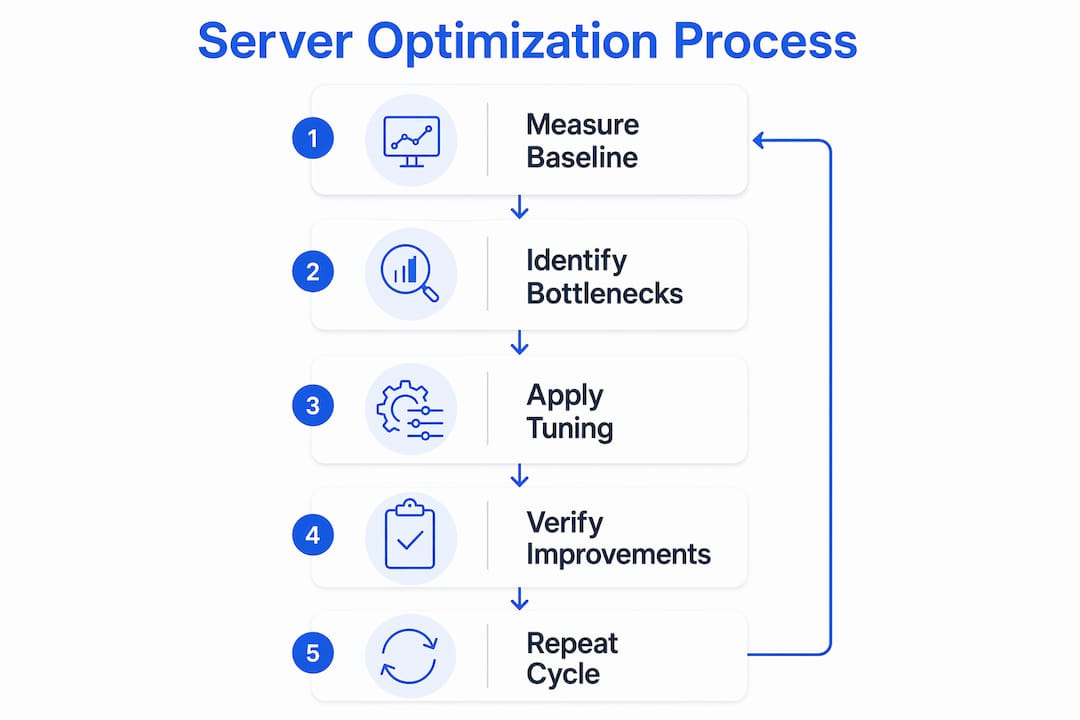
The windows server optimization process follows a clear sequence: baseline monitoring under normal and peak loads, bottleneck identification, and then targeted tuning of hardware or software. Skipping baselines leads to guesswork and suboptimal results. Every change you make without a baseline is a change you cannot measure, and unmeasured changes in production environments carry real risk.
Performance Monitor is the right starting point. Track these counters as your core baseline set:
- Processor: % Processor Time per core, not just total
- Memory: Available MBytes and Pages/sec to detect memory pressure
- PhysicalDisk: Avg. Disk sec/Transfer to catch storage latency
- Network Interface: Bytes Total/sec to identify saturation
Event Viewer complements Performance Monitor by surfacing warnings and errors that correlate with the spikes you see in counters. Task Manager gives you a fast, real-time view of process-level resource consumption during incident investigation. Use all three together, not in isolation.
Pro Tip: Capture baseline data during both normal business hours and peak load periods. A counter that looks healthy at 9 AM may tell a completely different story at month-end close when your ERP system is running batch jobs.
What hardware considerations matter most for server performance?
Hardware right-sizing is a first-order constraint. Undersized hardware limits the gains possible from any registry or software tuning change. Before you touch a single configuration setting, validate that your physical or virtual hardware matches the workload's average and peak demands, plus your response-time requirements.
The table below shows how hardware mismatches translate into specific performance symptoms and what to address first.
| Hardware component | Common symptom of undersizing | Primary resolution |
|---|---|---|
| CPU (cores/clock) | Sustained % Processor Time above 80% | Add vCPUs or upgrade physical cores |
| RAM | High Pages/sec, low Available MBytes | Increase RAM before tuning virtual memory |
| Storage (IOPS/latency) | Avg. Disk sec/Transfer above 20ms | Switch to NVMe or SSD-backed volumes |
| NIC (bandwidth/offload) | Network saturation, high CPU on receive | Replace with RSS-capable, higher-throughput adapter |
Storage design decisions have an outsized impact on server efficiency. Separating the OS volume, application data, and logs onto distinct volumes prevents I/O contention and makes performance profiling far cleaner. RAID configuration matters too: RAID 10 delivers better write performance than RAID 5 for transaction-heavy workloads, while RAID 5 suits read-dominant file server scenarios.
Pro Tip: When sizing for a scalable VPS workflow, always model peak load at 150% of your current peak. Workloads grow, and a server that runs at 70% CPU today will hit 95% within 18 months if you do not account for growth.
Which role-specific tuning settings improve Windows Server performance?
Role isolation is the single most underused windows server tuning technique in enterprise environments. Disabling unnecessary roles and features reduces CPU and memory overhead and eliminates tuning conflicts between services competing for the same resources. A domain controller running IIS and a file server role simultaneously is a configuration that creates problems no amount of registry tuning will fully resolve.
For file servers, SMB redirector parameters are the primary tuning levers. Two registry settings deserve attention on high-latency network paths:
- DisableBandwidthThrottling (set to 1): removes the SMB bandwidth throttle that limits throughput over high-latency WAN links
- DisableLargeMtu (set to 1): disables large MTU negotiation when jumbo frames cause fragmentation issues on specific network paths
SMB redirector tuning can improve throughput over certain networks, but changes must be staged and tested carefully with rollback ready. These settings behave differently depending on the network path and workload pattern, so never apply them globally without testing in a non-production environment first.
Domain controllers have different priorities. Replication latency, authentication throughput, and DNS query response time are the metrics that matter. Keep the AD DS database and SYSVOL on separate, fast volumes. Avoid co-locating resource-intensive application roles on domain controllers. For IIS and ASP.NET application servers, application pool isolation, worker process recycling schedules, and output caching configuration are the primary tuning areas.
The table below maps server roles to their highest-impact tuning targets.
| Server role | Primary tuning target | Key tool or setting |
|---|---|---|
| File server | SMB throughput, I/O latency | DisableBandwidthThrottling, volume separation |
| Domain controller | Replication, authentication speed | AD DS volume placement, DNS caching |
| IIS/ASP.NET server | Request throughput, memory use | Application pool isolation, output caching |
| General application | CPU and memory allocation | Role isolation, unnecessary feature removal |
How do network adapter settings affect Windows Server throughput?
Network tuning in Windows Server centers on three adapter-level settings: Receive Side Scaling (RSS), buffer sizes, and interrupt moderation. Each one involves a trade-off, and the right configuration depends entirely on your workload's CPU and latency priorities.
RSS distributes network receive processing across multiple CPU cores, which prevents a single core from becoming a bottleneck under high network load. The critical rule: avoid mixing RSS-capable and non-RSS-capable adapters on the same server. Mixed adapter configurations cause load distribution conflicts that degrade performance more than having RSS disabled entirely. Use RSS-capable adapters exclusively, or disable RSS on specific adapters when the workload demands it.
Increasing NIC receive and send buffers improves throughput under burst traffic but consumes additional memory. Start with the adapter's default buffer size, measure throughput and CPU load under peak conditions, then increase buffer size incrementally while monitoring both metrics. A buffer size that improves throughput by 15% but raises CPU utilization by 25% is not a net win for most workloads.
Interrupt moderation controls how frequently the NIC interrupts the CPU to process received packets. High interrupt moderation reduces CPU load by batching interrupts but increases latency. Low interrupt moderation reduces latency but raises CPU usage. For latency-sensitive workloads like financial transaction processing or real-time database queries, reduce interrupt moderation. For high-throughput file transfer workloads, higher moderation is the better trade-off.
TCP receive window autotuning, enabled by default in Windows Server 2016 and later, dynamically adjusts the TCP receive window size based on network conditions. Disabling it is rarely beneficial. If you see TCP throughput issues, investigate network path quality and adapter configuration before touching autotuning.
Pro Tip: Before changing any NIC setting, validate actual queue usage in Performance Monitor using the Network Interface counters. Assuming throughput gains from RSS without checking real queue distribution is one of the most common mistakes in Windows Server configuration.
How to perform incremental optimization and verify improvements safely
The most dangerous approach to server tuning is making multiple changes simultaneously. When performance improves or degrades after three simultaneous changes, you have no way to know which change caused the result. Incremental tuning with monitored rollback readiness is the only method that gives you reliable, reproducible results in production environments.
Follow this sequence for every tuning cycle:
- Document the current state. Export Performance Monitor counter logs, capture Event Viewer summaries, and record all relevant configuration settings before touching anything.
- Make one change. Apply a single tuning adjustment, whether it is a registry value, a role removal, a buffer size increase, or a power plan change.
- Monitor for a full business cycle. One hour of data is rarely sufficient. Monitor through at least one normal business day and one peak load period before drawing conclusions.
- Compare against your baseline. Use the same counters you captured in step one. Look for improvements in the specific bottleneck you targeted, not just overall CPU or memory averages.
- Document the outcome. Record what changed, what improved, what did not, and what the next tuning step will be.
- Prepare rollback before the next change. Snapshot the VM, export registry keys, or document the reversal steps before applying the next adjustment.
Common pitfalls to avoid: changing power plans without measuring the latency impact on network adapters, applying SMB registry settings without testing on the specific network path, and disabling services without confirming they are genuinely unused. Windows Server services have interdependencies that are not always obvious, and a disabled service can cause failures in unexpected places days after the change.
Key takeaways
Effective Windows Server optimization requires a measurement-first approach: baseline every counter before tuning, isolate roles, right-size hardware, and apply changes one at a time to maintain control and reproducibility.
| Point | Details |
|---|---|
| Baseline before tuning | Collect Performance Monitor counters under normal and peak load before any change. |
| Hardware sizing comes first | Undersized hardware limits all software tuning gains; validate capacity before configuration changes. |
| Isolate server roles | Running unnecessary roles increases overhead and creates tuning conflicts between services. |
| Tune network adapters carefully | Match RSS, buffer sizes, and interrupt moderation to workload CPU and latency priorities. |
| Change one setting at a time | Incremental tuning with documented rollback is the only way to attribute performance changes accurately. |
Why measurement discipline matters more than any single tuning trick
I have worked with Windows Server environments ranging from small business file servers to multi-tier enterprise deployments running SQL Server, Active Directory, and IIS simultaneously. The pattern I see most often is administrators who have read every tuning guide available but still struggle with performance. The reason is almost always the same: they skip the measurement step.
Applying DisableBandwidthThrottling to every file server because a forum post recommended it is not optimization. It is guessing with extra steps. The registry setting genuinely helps on high-latency WAN paths. On a low-latency LAN, it changes nothing or occasionally makes things worse. The only way to know which situation you are in is to measure first.
The other lesson I keep relearning is that hardware constraints are non-negotiable. I have spent hours tuning virtual memory settings on a server that simply needed more RAM. No amount of pagefile configuration compensates for genuine memory pressure. Check your Available MBytes counter before you open the registry editor.
What actually works in complex enterprise environments is treating optimization as a discipline rather than a one-time event. Document your baselines, document your changes, and revisit your counters after every significant workload change. A server that was well-tuned for last year's ERP version may be poorly tuned for this year's. The tools, Performance Monitor, Event Viewer, and Task Manager, have not changed. The discipline of using them consistently is what separates reliable infrastructure from infrastructure that surprises you at the worst possible moment. For teams considering a high-performance server investment, the same measurement-first principle applies before you commit to any hardware or hosting configuration.
— Lukasz
Take your optimized workloads to a purpose-built Windows Server environment

Applying the tuning techniques in this guide delivers real gains, but those gains compound when the underlying infrastructure is built for Windows Server workloads from the start. Netcloud24 provides enterprise-grade Windows VPS hosting with NVMe enterprise storage, high availability, and RDS licensing included, giving your optimized configurations a platform that matches their performance requirements. Environments are pre-configured and ready within five minutes, with built-in firewall protection, VPN access, and automatic backups. Whether you are running SQL Server, IIS, or multi-user business applications like Sage or Xero, Netcloud24's infrastructure is sized and secured for the workloads you have just finished tuning.
FAQ
What is the first step in optimizing Windows Server performance?
The first step is establishing a performance baseline using Performance Monitor to capture CPU, memory, disk, and network counters under both normal and peak load conditions. Without this baseline, you cannot measure whether any tuning change actually improved performance.
How do I identify a bottleneck on Windows Server?
Correlate user-reported symptoms with specific Performance Monitor counters: sustained % Processor Time above 80% points to CPU pressure, low Available MBytes with high Pages/sec indicates memory exhaustion, and Avg. Disk sec/Transfer above 20ms signals storage latency. Event Viewer errors appearing at the same time as counter spikes confirm the bottleneck location.
Should I disable RSS on Windows Server network adapters?
Only disable RSS if your server uses a mix of RSS-capable and non-RSS-capable adapters, since mixed configurations cause load distribution conflicts that degrade performance. If all adapters support RSS, keep it enabled and validate actual queue usage through Performance Monitor before making changes.
How often should Windows Server tuning be reviewed?
Review your performance baselines after every major workload change, application upgrade, or significant increase in user count. A server tuned for last year's workload may be poorly configured for current demands, and counters that looked healthy six months ago may now indicate emerging bottlenecks.
Can registry tuning alone fix Windows Server performance problems?
Registry tuning addresses software-level configuration constraints but cannot overcome hardware limitations. If Available MBytes is critically low or disk latency is consistently above 20ms, hardware right-sizing must come before any registry adjustment to see meaningful improvement.